

Access JMX metrics via Jolokia#
Jolokia is one of the external metrics integration supported on the Aiven platform besides Datadog metrics and Prometheus metrics.
Note
Only Aiven for Apache Kafka® has support for Jolokia integration.
Jolokia endpoint configuration#
To enable Jolokia integration for Aiven services, follow these steps to create a new Jolokia endpoint configuration:
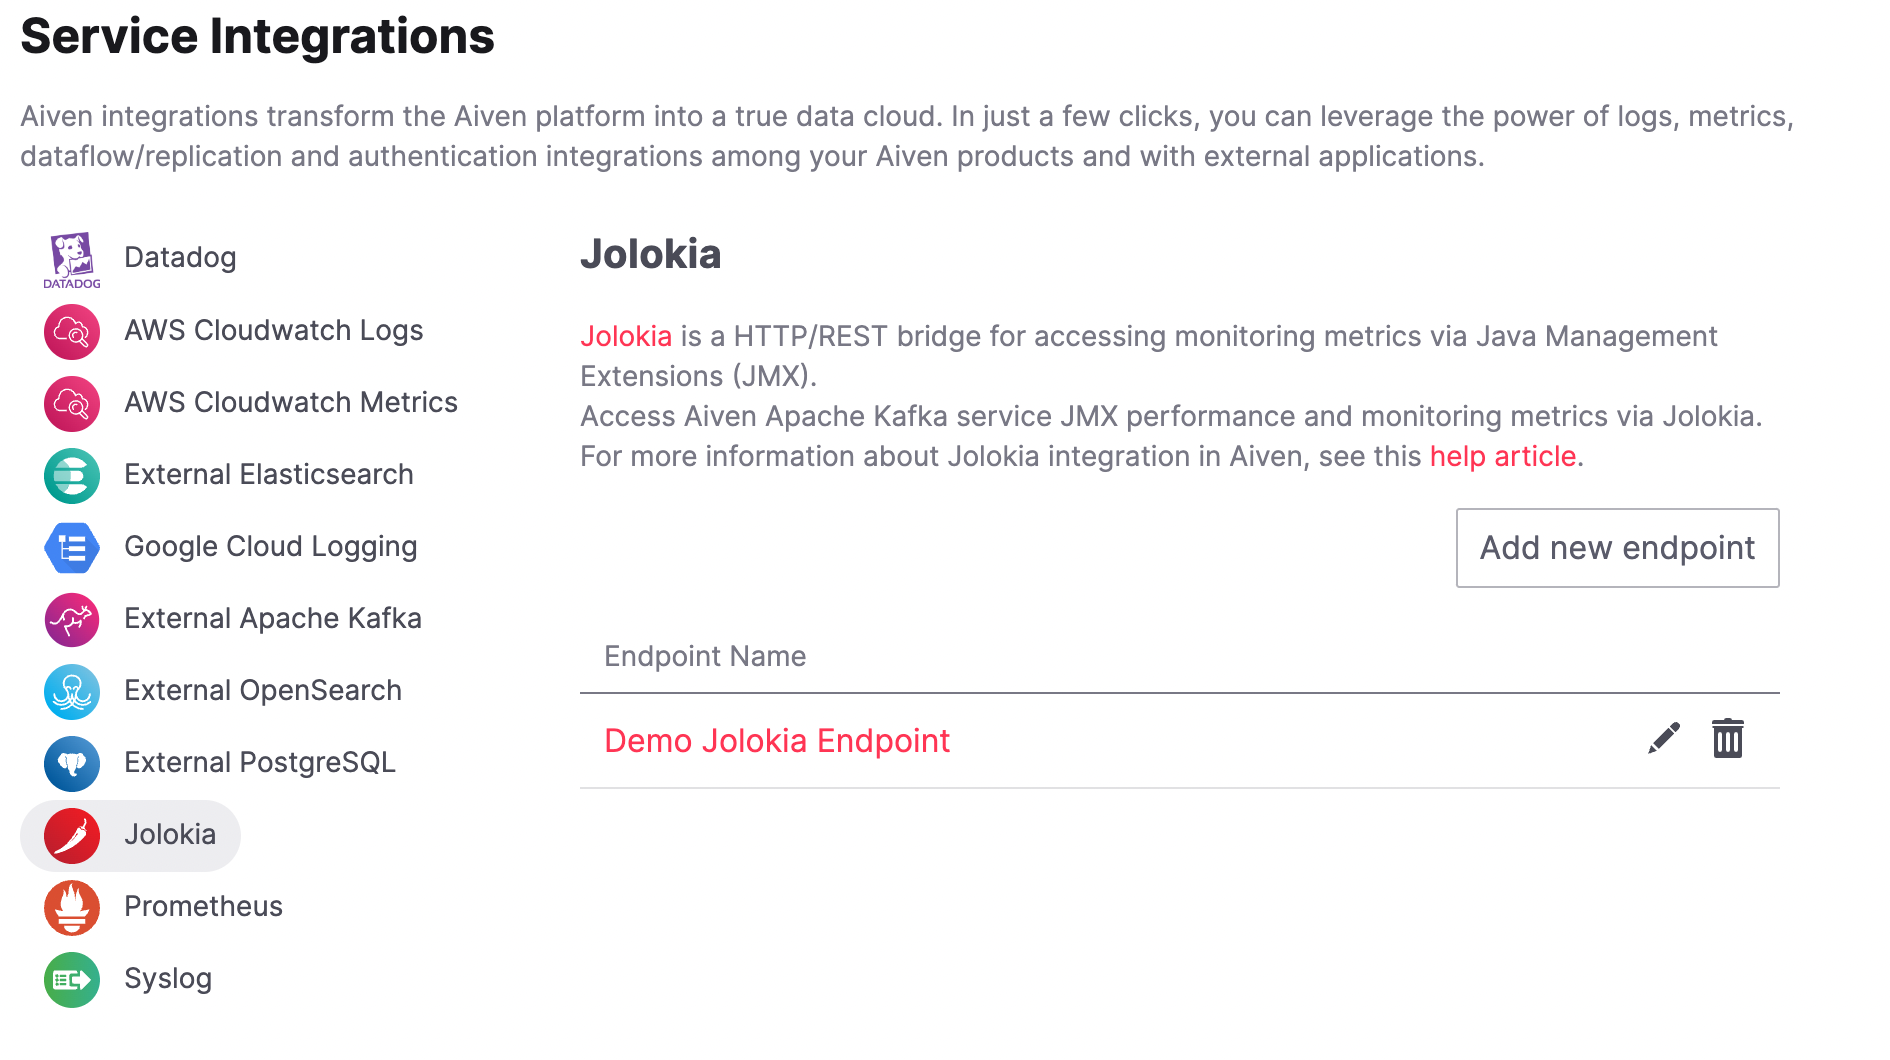
Log in to the Aiven console , and from the Services page, select Integration endpoints on the left sidebar.
In the Integrations page, select Jolokia, and then select Add new endpoint.
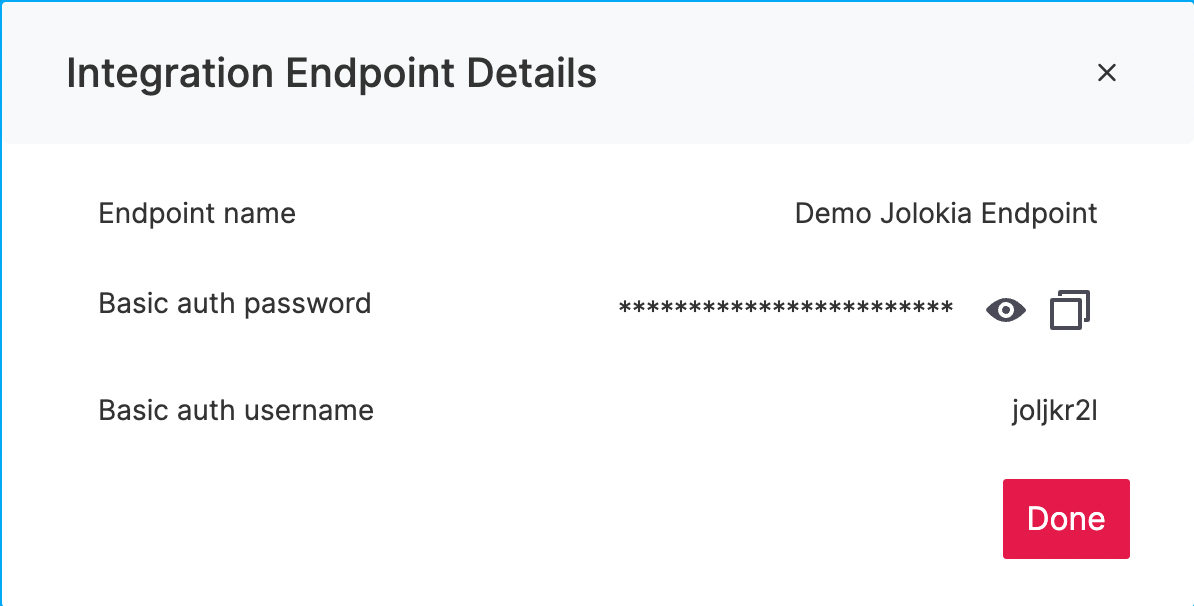
Enter an Endpoint name for the new Jolokia endpoint and select Create. The system will automatically generate a username and password for authentication. In most cases, you can reuse the same Jolokia endpoint configuration for all services within a project.
Note
You can create a new service endpoint using the Aiven CLI as well.
Enabling Jolokia integration#
To enable Jolokia integration for a specific service, follow these steps:
In the Aiven Console, open the service for which you want to enable Jolokia integration.
On the Overview page of your service, navigate to the Service integrations section, and select Manage integrations.
On the Integrations page, select Jolokia from the list.
Select the Jolokia endpoint you created and select Enable. The system will configure the Jolokia endpoint on all service nodes, providing access to the metrics.
The Aiven Jolokia integration enables HTTP POST requests to retrieve values from service-specific metrics. It also supports bulk requests for batch collection of metrics. For more detailed information on the Jolokia protocol, refer to Jolokia documentation .
Several metrics are specific to a Kafka® broker. Therefore, you may need to query each node to obtain a comprehensive overview. The node IP is represented by a single DNS name. You can use the host command on Unix systems or the nslookup command on Windows systems to retrieve the list of IP addresses associated with a DNS name.
host kafka-67bd7c5-myproject.aivencloud.com
kafka-67bd7c5-myproject.aivencloud.com has address 35.228.218.115
kafka-67bd7c5-myproject.aivencloud.com has address 35.228.234.106
kafka-67bd7c5-myproject.aivencloud.com has address 35.228.157.197
Example cURL requests#
Here is an example of a cURL request for accessing JMX metrics using Jolokia. Before executing the cURL request,:doc:download the CA certificate </docs/platform/howto/download-ca-cert> specific to your project. The CA certificate file is identical for all endpoints and services within the same project. Performing a cURL request to read a specific metric:
Ensure that you use port 6733, the default port for Jolokia. Replace joljkr2l:PWD with the username and password obtained during the Jolokia endpoint setup step. You can find these endpoint details on the Integration endpoints page.
curl --cacert ca.pem \
    -X POST \
    https://joljkr2l:PWD@HOST_IP:6733/jolokia/  \
    -d \
'{"type":"read","mbean":"kafka.server:type=ReplicaManager,name=PartitionCount"}'
Jolokia supports searching beans using search command:
curl --cacert ca.pem \
    -X POST \
    https://joljkr2l:PWD@HOST_IP:6733/jolokia/  \
    -d \
'{"type":"search","mbean":"kafka.server:*"}'